
 Cyberspace Work
 Cyberspace Pipeline
 Hesai Kosmo One
 NavVis MLX
 Handheld AR
 AR Pad
 All-in-One Appliance
 Buildings
 Rail & Transit
 Underground Pipelines
 Indoor Pipelines
 Industrial Plants
 Commercial Complexes
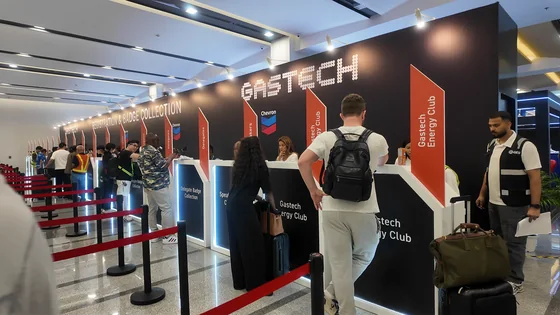
Gastech 2026 is behind us. Four days at BITEC in Bangkok, and what stayed with us were not the booth metrics or the demo queues. What stayed with us were the real challenges shared by people working in the field.
Gastech 2026 ran from 14 to 17 September at BITEC Bangna, drawing more than 50,000 registered energy professionals and over 1,000 exhibiting companies from more than 150 countries, according to the event organizers. It is one of the largest annual gatherings for the natural gas, LNG, and low-carbon energy value chain. For our team, it was four days of back-to-back conversations with gas utility engineers, maintenance planners, and operations managers from across Asia and beyond.
This article looks back at what those visitors told us, and at how AR pipeline inspection answers the problems they described. It is a recap of an event, but more importantly it is a summary of the field challenges that now sit on our product team's desk.
The Conversations That Stayed With Us
Three visitors, in particular, come back to mind.
The first was a field engineer who is tired of relying on manual measurements during routine inspections. His workflow has barely changed in years: tape measure, 2D drawings, a notebook, and a long walk along the route. Every measurement is taken by hand, every reading is transcribed later, and every verification depends on the experience of the person holding the tape.
The second was a maintenance manager whose team spends too much time locating assets, checking site conditions, and recording results by hand. Before any work starts, the crew has to find the asset in one system, confirm its condition on site, and fill in paper forms that reach the office days later. The data is accurate eventually, but the delay between the field and the office slows everything downstream.
The third was an operator looking for a better way to bring digital models and asset information directly into the field. His company already maintains GIS records and 3D models. The problem is that those models live on office workstations, while the assets they describe are buried under streets, tucked into plant rooms, or running through station yards. The data and the asset rarely meet in the same place.
Different problems, one common goal:
Make infrastructure easier to inspect, understand, and operate.
| Who we talked to | The daily friction | What they were looking for |
|---|---|---|
| Field engineer | Manual measurements, re-measured on every visit | Measurable, repeatable on-site verification |
| Maintenance team | Locating assets, paper records, delayed data entry | Asset positions and conditions available on the spot |
| Operator | Digital models stuck in the office | Models and asset data carried into the field |
None of this is a criticism of the people or the processes. Gas networks are mostly underground, in plants and stations, and in people's homes. They are difficult to see by nature. Records are often split across GIS databases, 2D drawings, and paper archives, and they drift out of alignment with the physical network as repairs and retrofits accumulate. The teams we spoke with were not asking for new technology for its own sake. They were asking for less manual work, better visibility, and more efficient operations.
Our Approach: Capture, Compare, Carry It Into the Field
Our answer to these challenges is simple to state and deliberate in design. The CyberSpace Pipeline Digitalization Solution, built on the Cyberspace Platform, follows three steps.
Capture the Site as It Is
Everything starts with reality capture. Field teams scan the site with LiDAR and handheld scanners, either as part of construction or as part of an inspection campaign, and the captured data is reconstructed into a 3D digital model of the network as it actually exists.
For newly built pipelines, capture takes place before backfilling. Once the trench is closed, the true position of the pipes is gone from view, so the window to record it accurately is the window before it closes. The resulting model records the route, depth, and key nodes such as welded joints and pipe connections, creating a digital as-built archive that stays queryable for the life of the asset.
Compare Reality With GIS Data
A 3D model on its own is only half the answer. The second step is comparison: placing reality next to existing GIS data, and checking whether they agree.
This is where a pipeline digital twin earns its keep. Existing GIS records can be imported in standard formats such as Excel and SHP, automatically converted into 3D pipeline models, and put through preliminary topology and spatial-data validation. Where the digital record and the physical site disagree, the differences are flagged for review. Validation logs are retained so the outcome of every check can be traced later, and validated data can be exported back to GIS formats. The record does not just get corrected; it gets corrected with evidence attached.
Bring It to the Field With AR-Assisted Inspection and Asset Information
The third step closes the loop that our third visitor described. Models and asset information are carried into the field on AR devices, including the Vision AR Pad and the Vision AR Handheld, and overlaid on the real site at true position and scale.
Standing at the trench or in the station yard, an inspector sees the pipeline model rendered over the actual ground, with asset attributes available on tap. Instead of locating an asset by cross-referencing a drawing against a street corner, the crew walks to the coordinate. Instead of recording observations on paper for later transcription, results are logged digitally against the model. On handheld terminals, an optional stand-off methane detection module adds gas screening to the same walk of the site.
AR-assisted inspection supports visual inspection, asset locating, and record verification. It is a complement to, not a replacement for, the specialized integrity testing that pipeline safety regimes require.
Three Scenarios Where AR Pipeline Inspection Delivers Value
The three-step workflow above shows up in three recurring scenarios for gas utilities.
New Pipeline Construction
Construction teams capture the network before backfilling and receive a 3D digital as-built record in return. The archive covers route, depth, and key nodes, and it serves later asset management, maintenance, inspection, and emergency response. Future crews inherit a record of what was actually built, not just what was planned.
Legacy Network Archive Update
For existing networks, imported GIS data is converted to 3D, validated against topology rules, and then verified on site through AR. Field teams confirm whether the digital record matches the physical network, and corrections flow back into GIS. This is the scenario our second and third visitors live in every day: closing the gap between aging records and the real network.
AR-Assisted Inspection and Maintenance
In daily operations, the platform supports zone-based network management, inspection task dispatch, hazard and issue tracking, and maintenance task management, with field logs archived as digital records. Inspection stops being a private notebook and becomes an auditable trail. A tier-1 city gas utility benchmark, for example, would find every check, correction, and work order attached to the same model of the same network.
A Validation Example, In Numbers
One example from our project work makes the legacy scenario concrete. In a GIS data validation project for a gas operator in China, we worked through a legacy network area covering approximately 30 kilometres. Across that area, the project identified and resolved 318 GIS records that required correction or update.
Every one of those 318 records was a place where the official record and the physical network disagreed. Each represented a potential misdirected excavation, a delayed emergency response, or a maintenance crew walking to the wrong coordinate. The project confirmed the pattern the Gastech conversations pointed to: when records and reality drift apart, field work pays the bill.
What We Took Back
Thank you to everyone who stopped by Stand R105, shared their challenges, and challenged us with your questions. We are taking those conversations back to the product team, because we believe technology matters when it solves real problems.
The requests we heard were consistent enough to act on. Field engineers want measurement that does not depend on a tape measure. Maintenance teams want asset data available at the asset. Operators want their models where their pipes are. Those are the requirements that will shape what we build next.
If you missed us in Bangkok and any of these challenges sound familiar, the conversation is still open. You can explore the CyberSpace Pipeline Digitalization Solution in detail, watch how the workflow runs end to end, or simply tell us about your network and the records that keep you up at night.